To plot amplitude and phase spectrum in Matlab, use the “fft” function and the “abs” and “angle” functions to calculate the magnitude and phase of the Fourier transform. Then use the “plot” function to visualize the spectrum.
In order to plot amplitude and phase spectrum in Matlab, you need to understand the Fourier transform, which is a mathematical technique that breaks down a signal into its constituent frequencies. The Fourier transform can be used to analyze signals in the time domain and convert them to the frequency domain.
In Matlab, you can use the “fft” function to perform the Fourier transform. Once you have the Fourier transform, you can use the “abs” and “angle” functions to calculate the magnitude and phase of the spectrum, respectively. Finally, use the “plot” function to visualize the amplitude and phase spectrum. This article will walk you through the steps to plot amplitude and phase spectrum in Matlab.
Credit: www.researchgate.net
Tools For Plotting
Tools for Plotting
Matlab is a powerful tool for plotting amplitude and phase spectrum. It contains various built-in functions for signal processing and plotting such as the Signal Processing Toolbox.
The fft function in Matlab is used to calculate the amplitude spectrum. The angle function is used to compute the phase spectrum. The plot function can then be used to plot both the spectra.
Matlab also provides the subplot function which allows multiple plots to be displayed in a single figure, making it easier to compare signals and spectra.
By using these tools, one can easily plot amplitude and phase spectra in Matlab for any given signal.
Generating Time Domain Signals
To plot an amplitude and phase spectrum in Matlab, you need to generate time domain signals. The most basic time domain signal is the sinusoidal signal, which is created using the built-in functions “sin()” and “cos()”. You can also create complex sinusoids using the “exp()” function.
Once you have generated the time domain signals, you need to sample them to convert them into a digital format. The sampling process involves selecting points from the analog signal at specific intervals. The number of samples per second is called the sampling rate.
You also need to quantize the signal, which involves assigning a numerical value to each sample. The number of bits used to represent each sample determines the resolution of the signal. Higher bit resolution results in a more accurate representation of the original signal, but also requires more storage space.
By generating, sampling, and quantizing time domain signals in Matlab, you can plot the amplitude and phase spectrum of a given waveform using the Fourier transform. This process allows you to analyze the different frequency components of a signal and understand its behavior in the frequency domain.
Converting Signals Into Frequency Domain
To convert signals into the frequency domain, we use the Fourier transform. It helps us to analyze the signal in terms of its frequency components. Fourier transform can be performed in two ways – by using the mathematical formula or by using software such as Matlab. In Matlab, we can perform the Fourier transform using the Discrete Fourier Transform (DFT) function. It is important to understand the difference between continuous and discrete Fourier transforms. The DFT function works only on discrete time signals, while the continuous Fourier transform works on continuous signals. Therefore, before using the DFT function, we need to sample the signal to convert it into a discrete time signal. Once we have the discrete time signal, we can apply the DFT function to get the amplitude and phase spectrum of the signal in the frequency domain.
Credit: www.ee.nmt.edu
Plotting Amplitude Spectrum
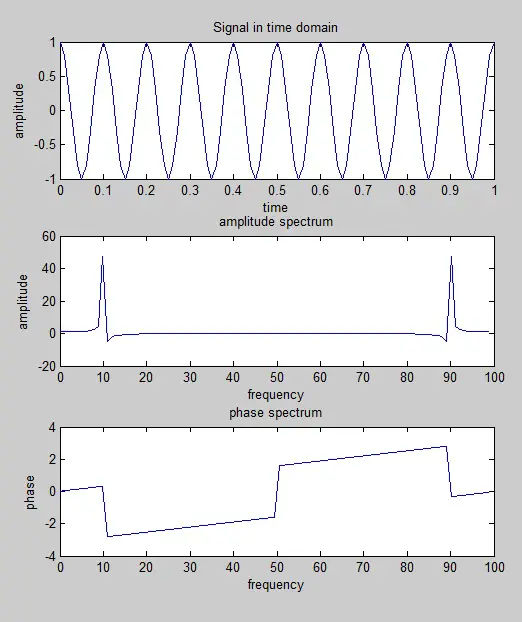
To plot the amplitude spectrum of a signal in Matlab, we can use the magnitude of the Fourier transform. This represents the magnitude of each frequency component in the signal. We can use the fft function to compute the Fourier transform and then calculate the magnitude using the abs function.
It’s important to normalize the amplitude spectrum before plotting to ensure that the magnitudes are on a consistent scale. We can do this by dividing each magnitude value by the total number of samples in the signal. This will give us the magnitude per unit of frequency.
Once we have the normalized magnitude values, we can plot the amplitude spectrum using the plot function or any graphing function in Matlab. The x-axis will represent the frequency values, and the y-axis will represent the normalized amplitude values.
By plotting the amplitude spectrum in Matlab, we can visualize the frequency components present in a signal and understand its frequency characteristics.
Plotting Phase Spectrum
Plotting a phase spectrum in Matlab is a simple process. It involves using the phase angle of a Fourier transform of a signal. In order to obtain the phase angle of a Fourier transform in Matlab, you can use the angle function. This function returns the phase angle in radians.
Once you have obtained the phase angle, you can use the plot function in Matlab to plot the phase spectrum. You should plot the phase spectrum against the frequency axis in order to clearly see the changes in phase over frequency. Don’t forget to label the x-axis and y-axis of your plot.
It is important to note that the phase spectrum is a wrapped phase spectrum, which means that it is limited to the range [-π, π]. If you want to unwrap the phase spectrum, you can use the unwrap function in Matlab.

Credit: stackoverflow.com
Conclusion
To sum up, plotting amplitude and phase spectrum in Matlab is a crucial task for engineers and researchers to analyze signals and systems. In this blog post, we have explored the different methods of plotting amplitude and phase spectra and how to interpret the results.
With the right approach and understanding of the concepts, one can generate informative plots that aid in analyzing signals and improving system performance. So, start exploring and implementing these techniques to master the art of plotting amplitude and phase spectra in Matlab.