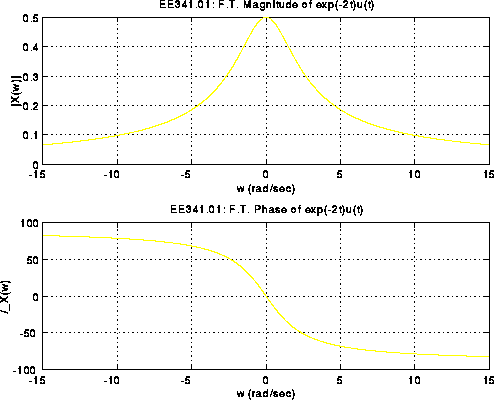
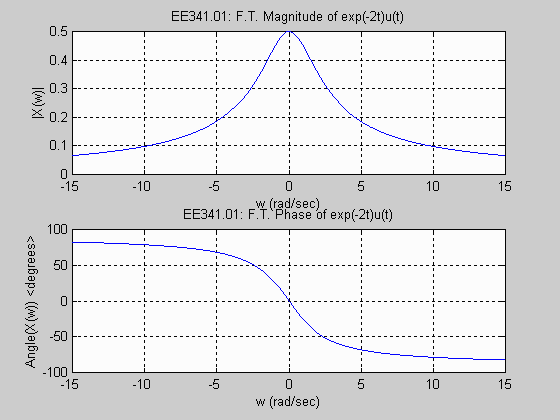
To plot magnitude and phase spectrum in Matlab, use the command “freqz.” This command returns the frequency response of a digital filter in two forms: magnitude and phase.
Matlab is a powerful tool for digital signal processing, providing numerous built-in functions to analyze and manipulate signals. One important aspect of signal analysis is understanding the frequency response of a signal, which describes how the signal responds to different frequencies.
Matlab offers the “freqz” command, which calculates and plots the magnitude and phase spectrum of a digital filter. This method is commonly used in audio and telecommunications engineering to measure the response of filters and equalizers to different frequency ranges. We will explore the steps for plotting magnitude and phase spectrum using Matlab, along with some key concepts for understanding these spectra.
Preparation
To plot magnitude and phase spectrum in Matlab, you need to start with the preparation by importing data into Matlab. Firstly, you need to import the data that you want to analyze. You can import the data from a file or generate it using the MATLAB itself. Once you have the data, you need to determine the sampling frequency, which is the number of samples per second. Also, create a time vector that specifies the time intervals between each sample. The length of FFT (Fast Fourier Transform) determines the frequency resolution of the spectrum.
| Importing Data into Matlab | |||
| Sampling Frequency | Time Vector | FFT Length | |
| Import the data that needs to be analyzed. | Determine the number of samples per second. | Create a time vector specifying intervals of each sample. | Determine the length of FFT. |
Make sure you import the data into Matlab correctly, otherwise, it could cause errors in the analysis. Once you have the data, sampling frequency, time vector, and FFT length you can proceed with plotting the magnitude and phase spectrum using MATLAB functions.

Credit: www.ee.nmt.edu
Magnitude Spectrum
Plotting magnitude and phase spectrum is a common task in signal processing. In Matlab, this can be done using Fast Fourier Transform (FFT) functions. Firstly, FFT calculates the magnitude and phase spectrum of a signal. The frequency binning method is used to discretize signals in frequency domain. Single-sided spectrum is used to show half of the spectrum and avoid repetition. Magnitude scaling is important to avoid signal overflow during plot creation.
| FFT Calculation | Calculate FFT of the signal using fft() function. |
|---|---|
| Frequency Binning | Discretize the signal in frequency domain using freq_bin = (0:N-1)fs/N, where N is the length of the signal and fs is the sampling frequency. |
| Single-Sided Spectrum | Take the first half of the spectrum only using mag = 2abs(Y(1:N/2+1)), where Y is the FFT of the signal. |
| Magnitude Scaling | Scale the magnitude using mag = mag/max(mag) to avoid overflow during plot creation. |
Phase Spectrum
Phase SpectrumIn signal processing, the phase spectrum represents the phase shift introduced to each frequency component of a signal. Obtaining the phase spectrum can be done in Matlab using the function ‘angle’.
Phase Calculation
The function ‘angle’ extracts the phase angle of each frequency component of a signal. However, the output of ‘angle’ is wrapped around the range -pi to pi which can make interpretation difficult. To fix this issue, we can use the function ‘unwrap’ which avoids phase jumps greater than pi. If the signal has a DC component, we can use the function ‘unwrap’ with the argument ‘[],2pi)’ to avoid phase jumps greater than 2pi.
Frequency UnwrappingIf a signal has a linear phase, it appears as a frequency ramp in the phase spectrum. However, non-linear phase may cause the phase spectrum to have discontinuities. To fix this issue, we use frequency unwrapping, which removes phase increments greater than pi by adding 2pi (or subtracting it if the increment is less than -pi) to each sample of the phase spectrum.
Frequency ShiftingFrequency shifting can be achieved by multiplying the signal by a complex exponential. This results in a phase shift of the signal proportional to the frequency offset. To achieve a phase shift of the form 2pift, we can multiply the signal by exp(1j2pift).
Phase ScalingTo scale the phase spectrum by a factor b, we can multiply the signal by exp(1jb).

Credit: stackoverflow.com
Plotting Results
When plotting magnitude and phase spectrum in Matlab, it is important to present the plotting results clearly and effectively. For magnitude and phase plots, MatLab uses the function ‘plot’. The frequency axis is an important factor to consider when plotting results and can be set using the ‘freqz’ command. Axis labels and titles should be included to provide context and understanding to the reader. Proper plot formatting such as using different colors and line styles can also enhance the clarity of the results. By following these guidelines, you can ensure that the magnitude and phase spectrum plots in Matlab are presented effectively.
| Guidelines | Explanation |
|---|---|
| Magnitude and Phase Plots | Use ‘plot’ function in Matlab for plotting the magnitude and phase plots. |
| Frequency Axis | Set the frequency axis using the ‘freqz’ command. |
| Axis Labels and Titles | Include axis labels and titles to provide context and understanding to the reader. |
| Plot Formatting | Use different colors and line styles to enhance the clarity of the results. |

Credit: www.ee.nmt.edu
Conclusion
Understanding magnitude and phase spectrum is essential for signal processing and analysis. By using Matlab, plotting these spectra becomes a less daunting task. Through this tutorial, we explored the basics of creating magnitude and phase spectra plots in Matlab. The steps involved include loading and plotting time-domain data, applying the Fourier transform, then plotting magnitude and phase spectra.
With the knowledge gained from this tutorial, you can continue to explore and analyze signals with ease in Matlab. Happy plotting!
